
Resource
Georgia’s
80-80 Schools
The Harm of Concentrated Poverty and How to Undo It

Introduction
The connection between poverty and school performance is well documented nationwide and in Georgia.
Low-income students are much more likely to deal with housing and food insecurity, poor transportation and healthcare, community violence, exposure to lead poisoning or air pollution.¹ High-poverty schools frequently experience higher rates of teacher and leader turnover. They are less likely to offer advanced coursework and more likely to employ discriminatory disciplinary policies.
For these reasons high poverty schools perform much worse on average than their counterparts. This connection leads many to believe that on balance poor kids are predestined to poor grades regardless of the school.
Evidence in Georgia complicates that belief, and research shows the connection can be disrupted.
Data shows that low-income students in Georgia do measurably better in schools with a strong mix of students across economic lines — a fact supported by a strong body of research.²
To better understand the problem, let’s create two identical students: Riley and Peter.
¹ Ed Fund. Concentrated Poverty. Retrieved from: https://corpus.ed-fund.org/concentrated-poverty
² For a review of the research on concentrated poverty and outcomes, see: Concentrated Poverty. Brown’s Promise. Retrieved from: https://www.brownspromise.org/concentrated-poverty
A thought experiment: Riley and Peter
Riley and Peter are typical boys in Georgia.
They’re both in low-income families as defined by the state’s measure of poverty: direct certification.³
Each child is in fifth grade in a public elementary school.
The only difference between them is the make-up of the school they attend.
Riley
Attends a school with a good mix of students across the economic spectrum
Peter
Attends a school with overwhelmingly low-income students


Riley goes to Riley Elementary where there’s a good mix of students economically (summary of the data for schools at or below the state average in poverty, 47.5 percent), while Peter’s school is overwhelmingly low-income students (summary of schools with 80 percent or more low-income students).
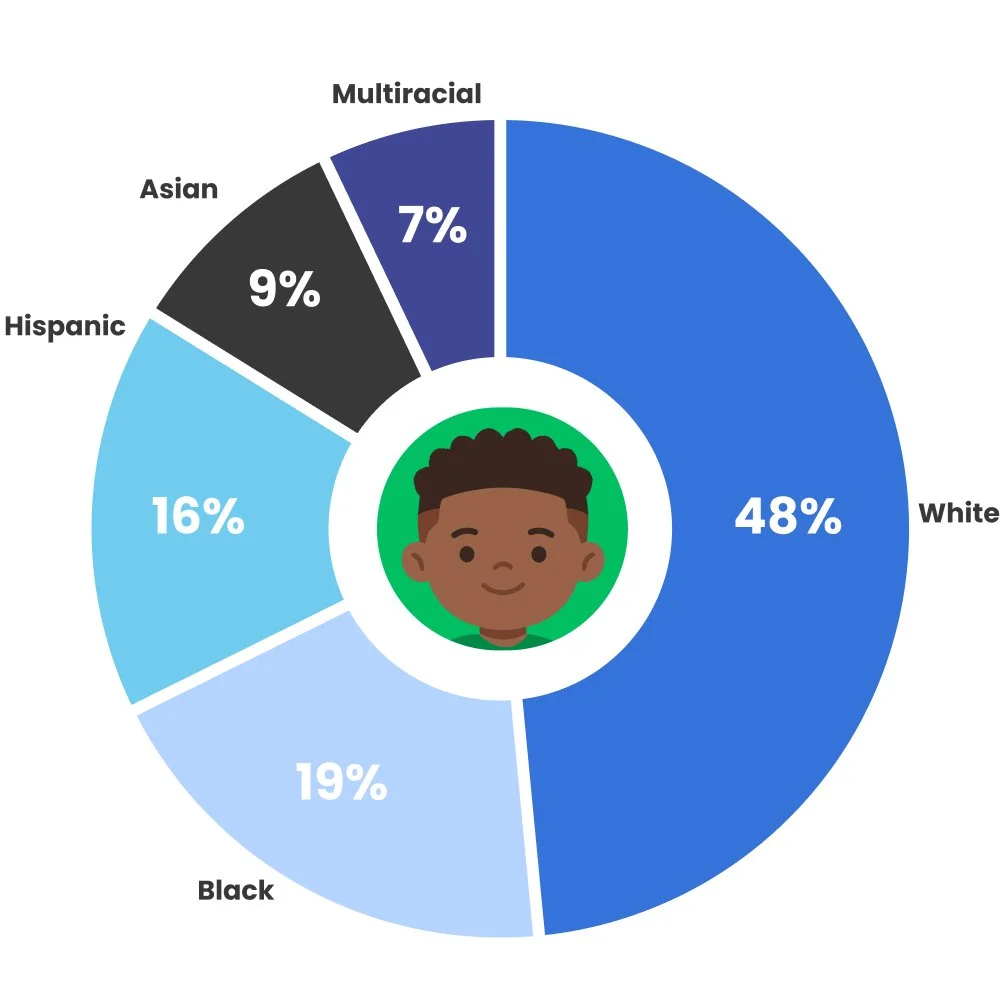
Riley goes to school with a student body where Black students are underrepresented (19 percent in the school, compared to 39 percent of fifth graders statewide) and over twice the percentage of Asian students (9 percent compared to 4.2 percent statewide).
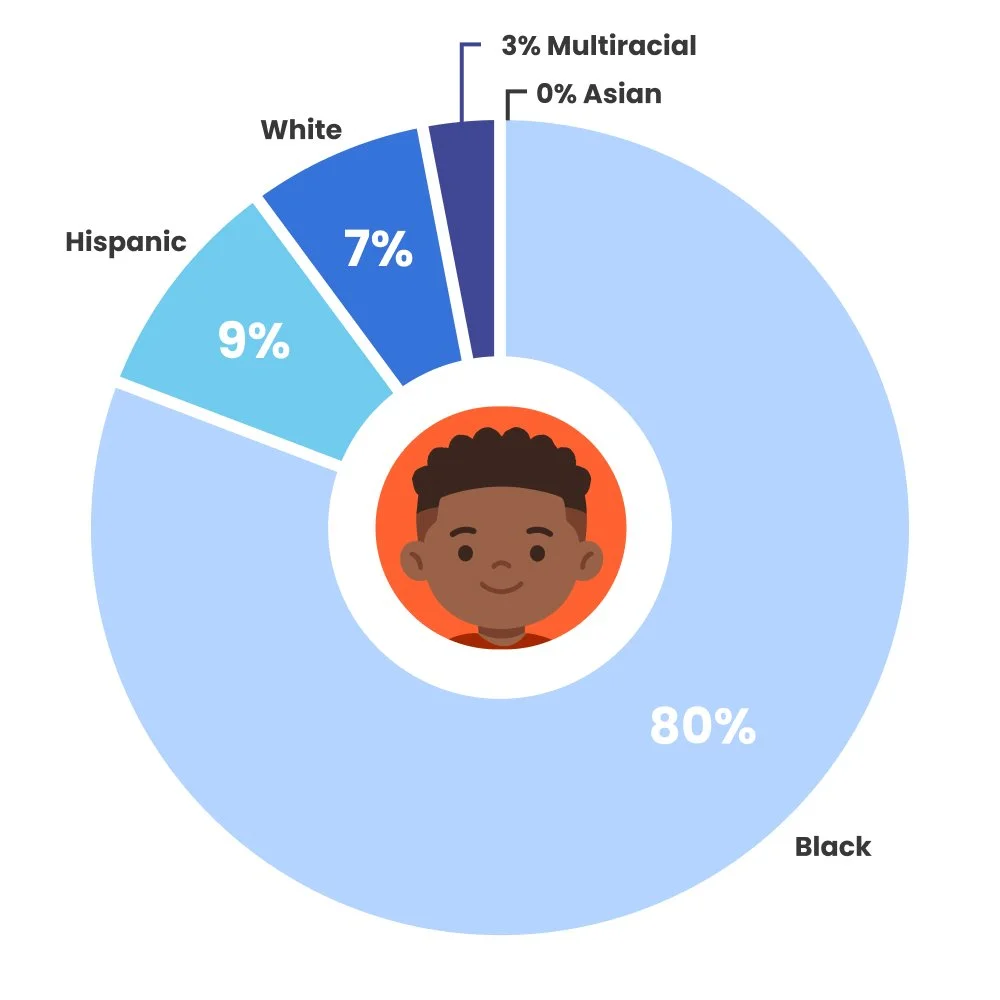
Peter, by comparison, has no Asian students in his school and four out of every five of his classmates is Black–40 percentage points higher than the state average.
³ Direct Certification means they are directly certified for free lunch in school by their condition (e.g., homeless, foster child, migrant or unaccompanied), because their parents/guardians are enrolled in a program for low-income families (SNAP, TANF) and/or their Medicaid income “does not exceed free or reduced priced lunch eligibility standards.”
Riley Elementary:
30% Poverty
Peter Elementary:
86% Poverty
Both schools have a similar percentage of students with disabilities (13 percent).
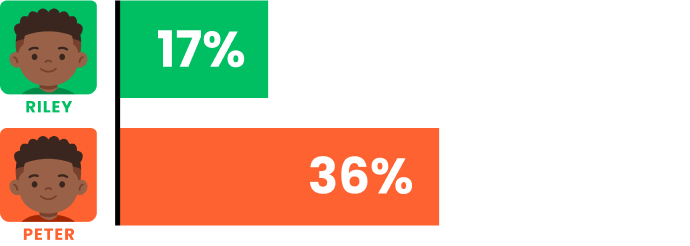
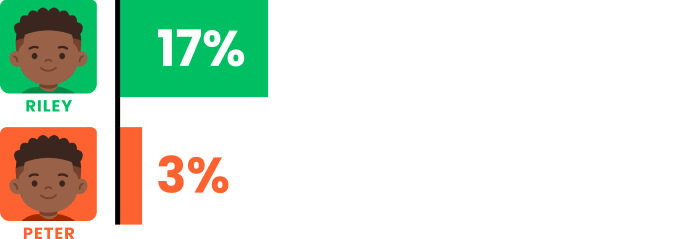
Riley’s school has a good mix of students in the Early Intervention Program (EIP), meant for students falling behind grade level (17 percent), and the Gifted Program for those who show high aptitude and motivation (17 percent).
Peter’s school, however, has twelve times the number of kids in EIP (36 percent) as Gifted (3 percent).
Percentage of students in the Early Intervention Program
Percentage of students in the Gifted Program
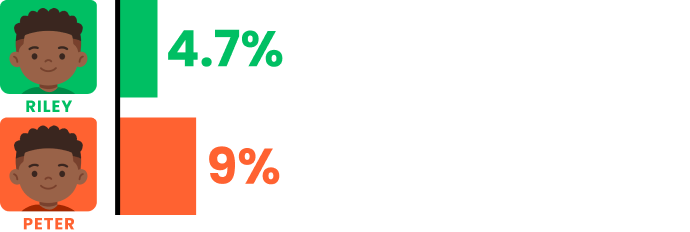
Peter’s school has nearly twice the number of teachers on provisional certificates (9 percent versus 4.7 percent in Riley’s) and fewer experienced teachers.
Research shows that teachers gain significant skills in their first three years in the classroom.⁴
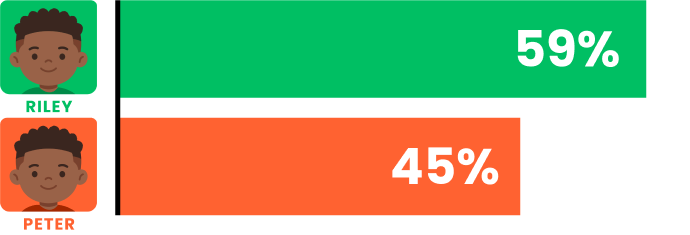
Fewer than half of Peter’s teachers have four or more years of experience (45 percent) while 59 percent of Riley’s teachers have passed this critical milestone.
⁴ Kini, T., & Podolsky, A. (2016). Does Teaching Experience Increase Teacher Effectiveness? A Review of the Research. Learning Policy Institute.
Percentage of teachers with 4+ years of experience
Percentage of teachers on provisional certificates
Over the 180-day school year, nearly a quarter of Peter’s classmates (24.5 percent) will miss 27 days⁵ or more of school while that rate is 14.2 percent for Riley’s school.
⁵ The state of Georgia categorizes being absent from school 15 percent of the school year as “chronically absent.” 15 percent of 180 days is 27 school days.
Students who will miss 27+ days of school in the school year

14.2% will miss 27 days or more of school

24.5% will miss 27 days or more of school
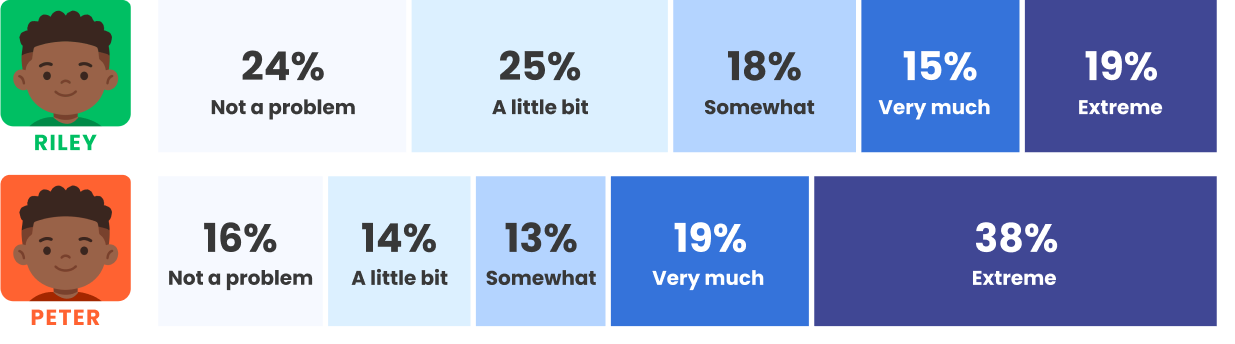
While some students at both schools report bullying as a problem, the level is completely off-balance: 24 percent of Riley’s classmates report the bullying as “extreme” or “very much a problem” and 57 percent report the same at Peter’s school.
Responses to prompt:
This year at school, how big of a problem is bullying?
Despite Peter and Riley having the same financial situation, Peter’s school contains many more students with unaddressed needs being educated by teachers who are less prepared and credentialed.
This combination of high needs, environmental factors and less-qualified educators bears out in vastly different education outcomes. Each year students in 3rd through 8th grade take the state standardized tests, the Georgia Milestones Assessment System.
Performance on this exam predicts future success in and outside the classroom. The Governor's Office of Education and Workforce Strategy found that students who pass the 3rd grade English Language Arts have higher GPAs in high school, are much more likely to be eligible for the HOPE Scholarship, and enroll in college. Less than half of the students who failed, on the other hand, even enrolled in a postsecondary institution after high school. ⁶
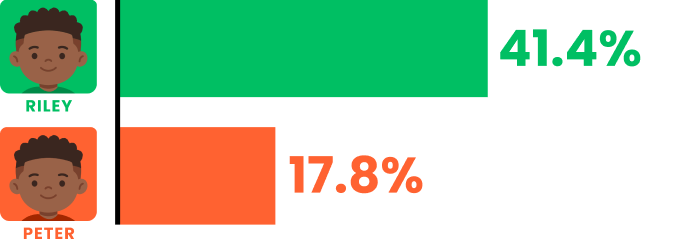
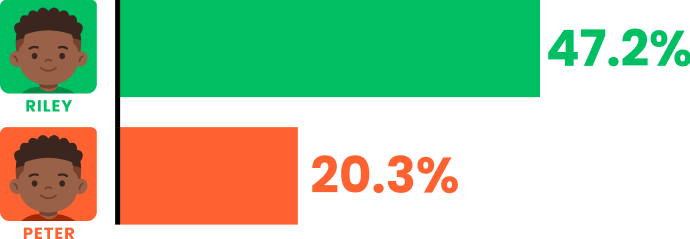
80 percent of Peter’s school will fail the Mathematics Milestones (score Beginning or Developing) and 82 percent will fail English. Three times the number of students will pass these tests at Riley’s school than Peter’s.
Here’s where it is important to dispel the myth: it’s not just that Riley’s school does better on standardized tests because they have more middle- and upper-income students.
Low-income students at Riley’s school are twice as likely to pass than at Peter’s.
Poor students are not predestined to poor results.
⁶ Governor's Office of Education and Workforce Strategy. (2026). Early Readers, Lasting Odds: 3rd Grade Reading Proficiency and High School Outcomes in Georgia.
Percentage of low-income students who are proficient in Georgia’s standardized test in English
Directly certified by free lunch
Percentage of low-income students who are proficient in Georgia’s standardized test in Math
Directly certified by free lunch
Poverty in Later Grades
High poverty schools like Peter’s can be found across the state, and are not limited to elementary grades.
Once these students enter high school, not only does this poor performance continue, but the difference in resources becomes plain.
The more kids in poverty that a school teaches, the fewer advanced coursework offerings, like Advanced Placement courses, are available.
Of those students in the band of schools with highest poverty, the majority did not have a student take a single AP course. In schools with fewer than 20 percent low-income students, by comparison, students took advantage of over 26 AP courses on average and 88 percent of test takers scored a 3 or higher. See the table below.
Table 1: School Demographics, Advanced Placement Subject and Performance
Source: Based on an analysis of Georgia Department of Education data. Advanced Placement (AP) Scores (2024-25).
Again, it’s time to debunk the myth: it’s not that low-income students are destined to score badly on these tests or are unable to do well in school. In high school, like we saw in elementary schools, low-income students score measurably better in schools where they are not in concentrated poverty.
Figure 8: Georgia Milestones End-of-Course Performance and Income
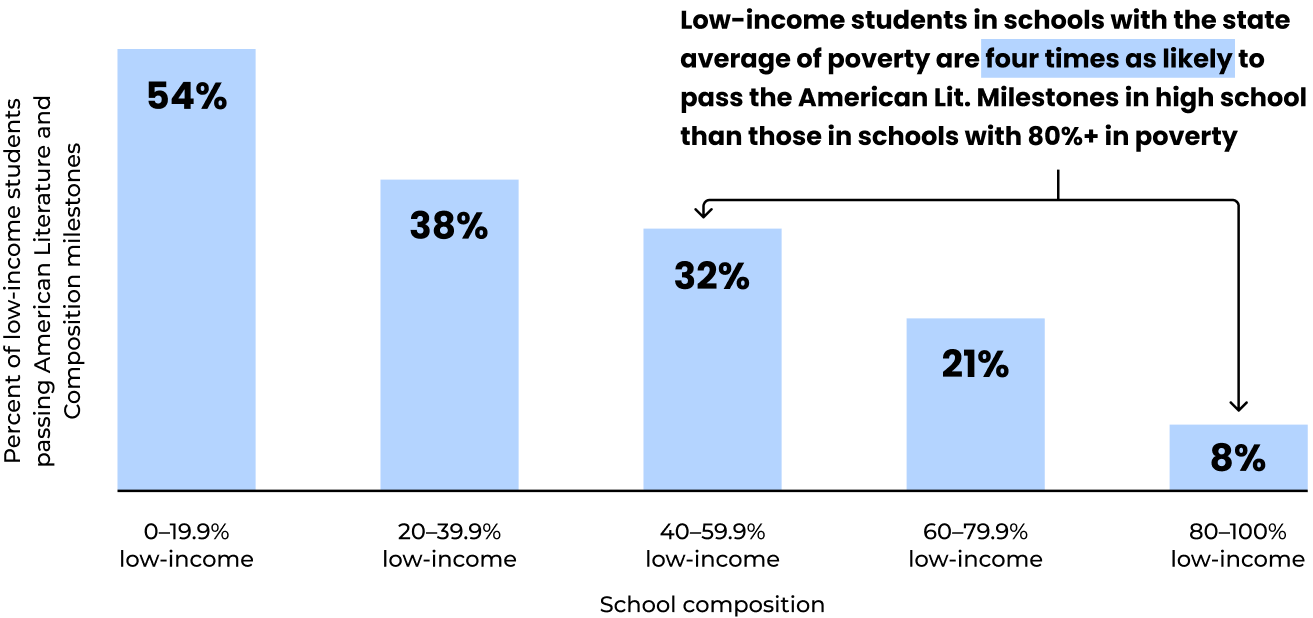
Source: Based on an analysis of Georgia Department of Education data. Georgia Milestones End-of-Course (EOC) Assessments (2024-25). Note: Georgia does not report data if fewer than 15 students are recorded. Therefore there are too few non-economically disadvantaged students in schools with 80 percent or more in poverty.
Packing students in high poverty schools hurts the performance of everyone, regardless of income. Concentrated poverty–how to undo it and/or how to address the consequences of it–should be a top priority for anyone who cares about education in Georgia.
80-80 Schools: Poverty Packing
Peter’s high-poverty school is imaginary, but it is all too real for the students attending schools just like it across the state.
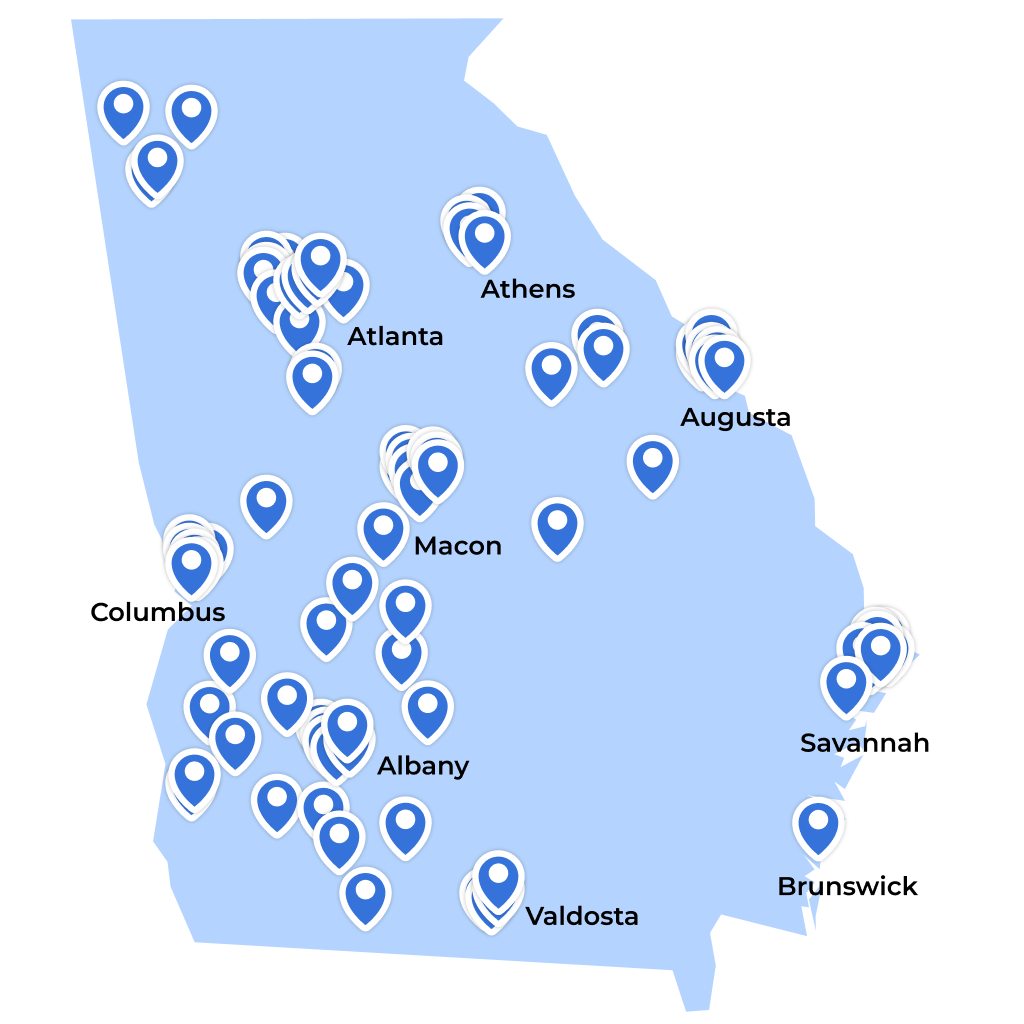
There are roughly 200 schools with 80 percent or more low-income students in Georgia. In 4-5ths of them 80 percent of the students failed either English or Math on the Milestones in 2025–I call these “80-80 schools.”
The map below shows where each of these schools is located.
Georgia’s 80-80 schools
Schools with 80 percent or more low-income students, with 80 percent of the students failed either English or Math.
Browse Georgia’s 80-80 schools by school system
Schools with 80 percent or more low-income students, where 80 percent of the students failed either English or Math.
There are 1.7 million students in K-12 schools in Georgia. 80-80 schools serve just under 64,000 of them, across 37 districts.
Half of the students in an 80-80 school (around 33,700 students) are in only four districts:
Atlanta Public Schools
Bibb County
Richmond County
Dougherty County
Discussion: Unpack Poverty
Our fictional Peter and Riley have identical family incomes, but have vastly different schools.
Riley’s economically diverse experience — including being in classrooms led by stable, experienced teachers, less bullying, and options for academic rigor — should be offered to all students.
Policymakers can (and should) take action to make sure all the Peters in Georgia get similar chances.
While 80-80 schools showcase the worst-of-the-worst, 80 percent is not a magical number. As the charts above illustrate, it is extremely hard to teach and learn in high poverty schools. Policymakers should “unpack” poverty at every level.
The paths to get there might look different in different parts of the state, and depending on the demographics in each school district and geographic region. School district leaders with some high poverty schools and other medium- and low-poverty ones have wide latitude to distribute students and resources fairly. From pairing schools to redrawing enrollment zones, there are several well-tested avenues to unpack poverty within these districts, creating a much fairer playing ground for all.
Districts where all the schools have above-average poverty, however, require a regional approach, and more state involvement. Several high poverty districts share a border with another school system that holds a much smaller share of low-income students. The table below gives one example:
Table 2: Direct Certification Rates by District
Source: Georgia Department of Education data. Direct Certification (District Level) (2024-25).
Georgia holds at least 19 borders like this, dividing districts that have greater than 20 percentage points difference in low-income enrollment. ⁷
These 38 districts are educating 4 out of the 5 students enrolled in an 80-80 school. That means that for many students like Peter, there is no need to go to a school where nearly all of his peers are also experiencing the challenges of growing without enough money. This proximity should be exploited to the gain of students.
Georgia has existing policy options that allow people to think across district lines like magnet schools. With proper guardrails and supports like transportation, a magnet school strategy could attract students from multiple communities and “unpack” poverty. It would also alleviate pressure for systems struggling with the reality of declining enrollment.⁸ Many states offer between-district enrollment or voluntary busing. Promising ideas like creating regional plans to pool resources and share students across districts offer other pictures of what the state could do if not bound by invisible lines.⁹ Policymakers intent on addressing the harms of concentrated poverty should use one (or several) of them with the explicit goal of eliminating 80-80 schools as much as practicable.
A large portion of high-poverty schools could be improved with these programs, designed and implemented to deconcentrate poverty. But what about those like Calhoun County Middle-High that’s over 40 miles from the closest school with fewer than 50 percent students in poverty? For those more rural schools, deconcentrating poverty is not feasible, so the state would have to provide transformational investments in the areas that impact students most, like educator quality, facilities and wraparound services, and ensure that the dollars are used well by local leaders to truly support all students.
Georgia is filled with Rileys and Peters: low-income children who want to use their education to escape poverty for themselves and their families. State lawmakers need to stop assuming we will always have a bunch of “poor schools” scattered across the state. In fact, the maps and the data make it clear that in most cases, there really is no compelling reason to keep packing poverty into a small number of schools the way we are today. It is time to disrupt this pattern, because research is clear that school composition plays an outsized role in education’s ability to disrupt, or cement, the connection between poverty and outcomes. As the data makes clear, for many low-income students opportunity might lie right next door.
⁷ See the appendix for a list
⁸ Brown’s Promise and The Century Foundation. When Enrollment Drops: A Magnet School Strategy for Districts. Retrieved from: https://tcf.org/content/commentary/when-enrollment-drops-a-magnet-school-strategy-for-districts-committed-to-excellence-equity-and-diversity/
⁹ See the Omaha Learning Community. Holme, J. J., & Diem, S. (2015). Regional Governance in Education: A Case Study of the Metro Area Learning Community in Omaha, Nebraska. Peabody Journal of Education, 90(1), 156–177. https://doi.org/10.1080/0161956X.2015.988546
Appendix: Highly Segregative School District Lines
Explore our efforts
If we want to end educational inequity, we need to end racial and economic segregation in public schools.
Access to Integrated and well-resourced schools is not only a right promised by Brown v. Board, it is one of the keys to significantly improving student outcomes on a meaningful scale. We have the tools and the power to give every child in America the education they deserve.
Learn more about state policy solutions to end segregation →

Read next

What we can do
State Policy Solutions
We have identified five key policy solutions for state leaders. Progress in any one of these areas would help, but the best results will come from doing them all together.