Resource
States of
Segregation
Ranking the states on racial and economic segregation in public schools


School segregation today
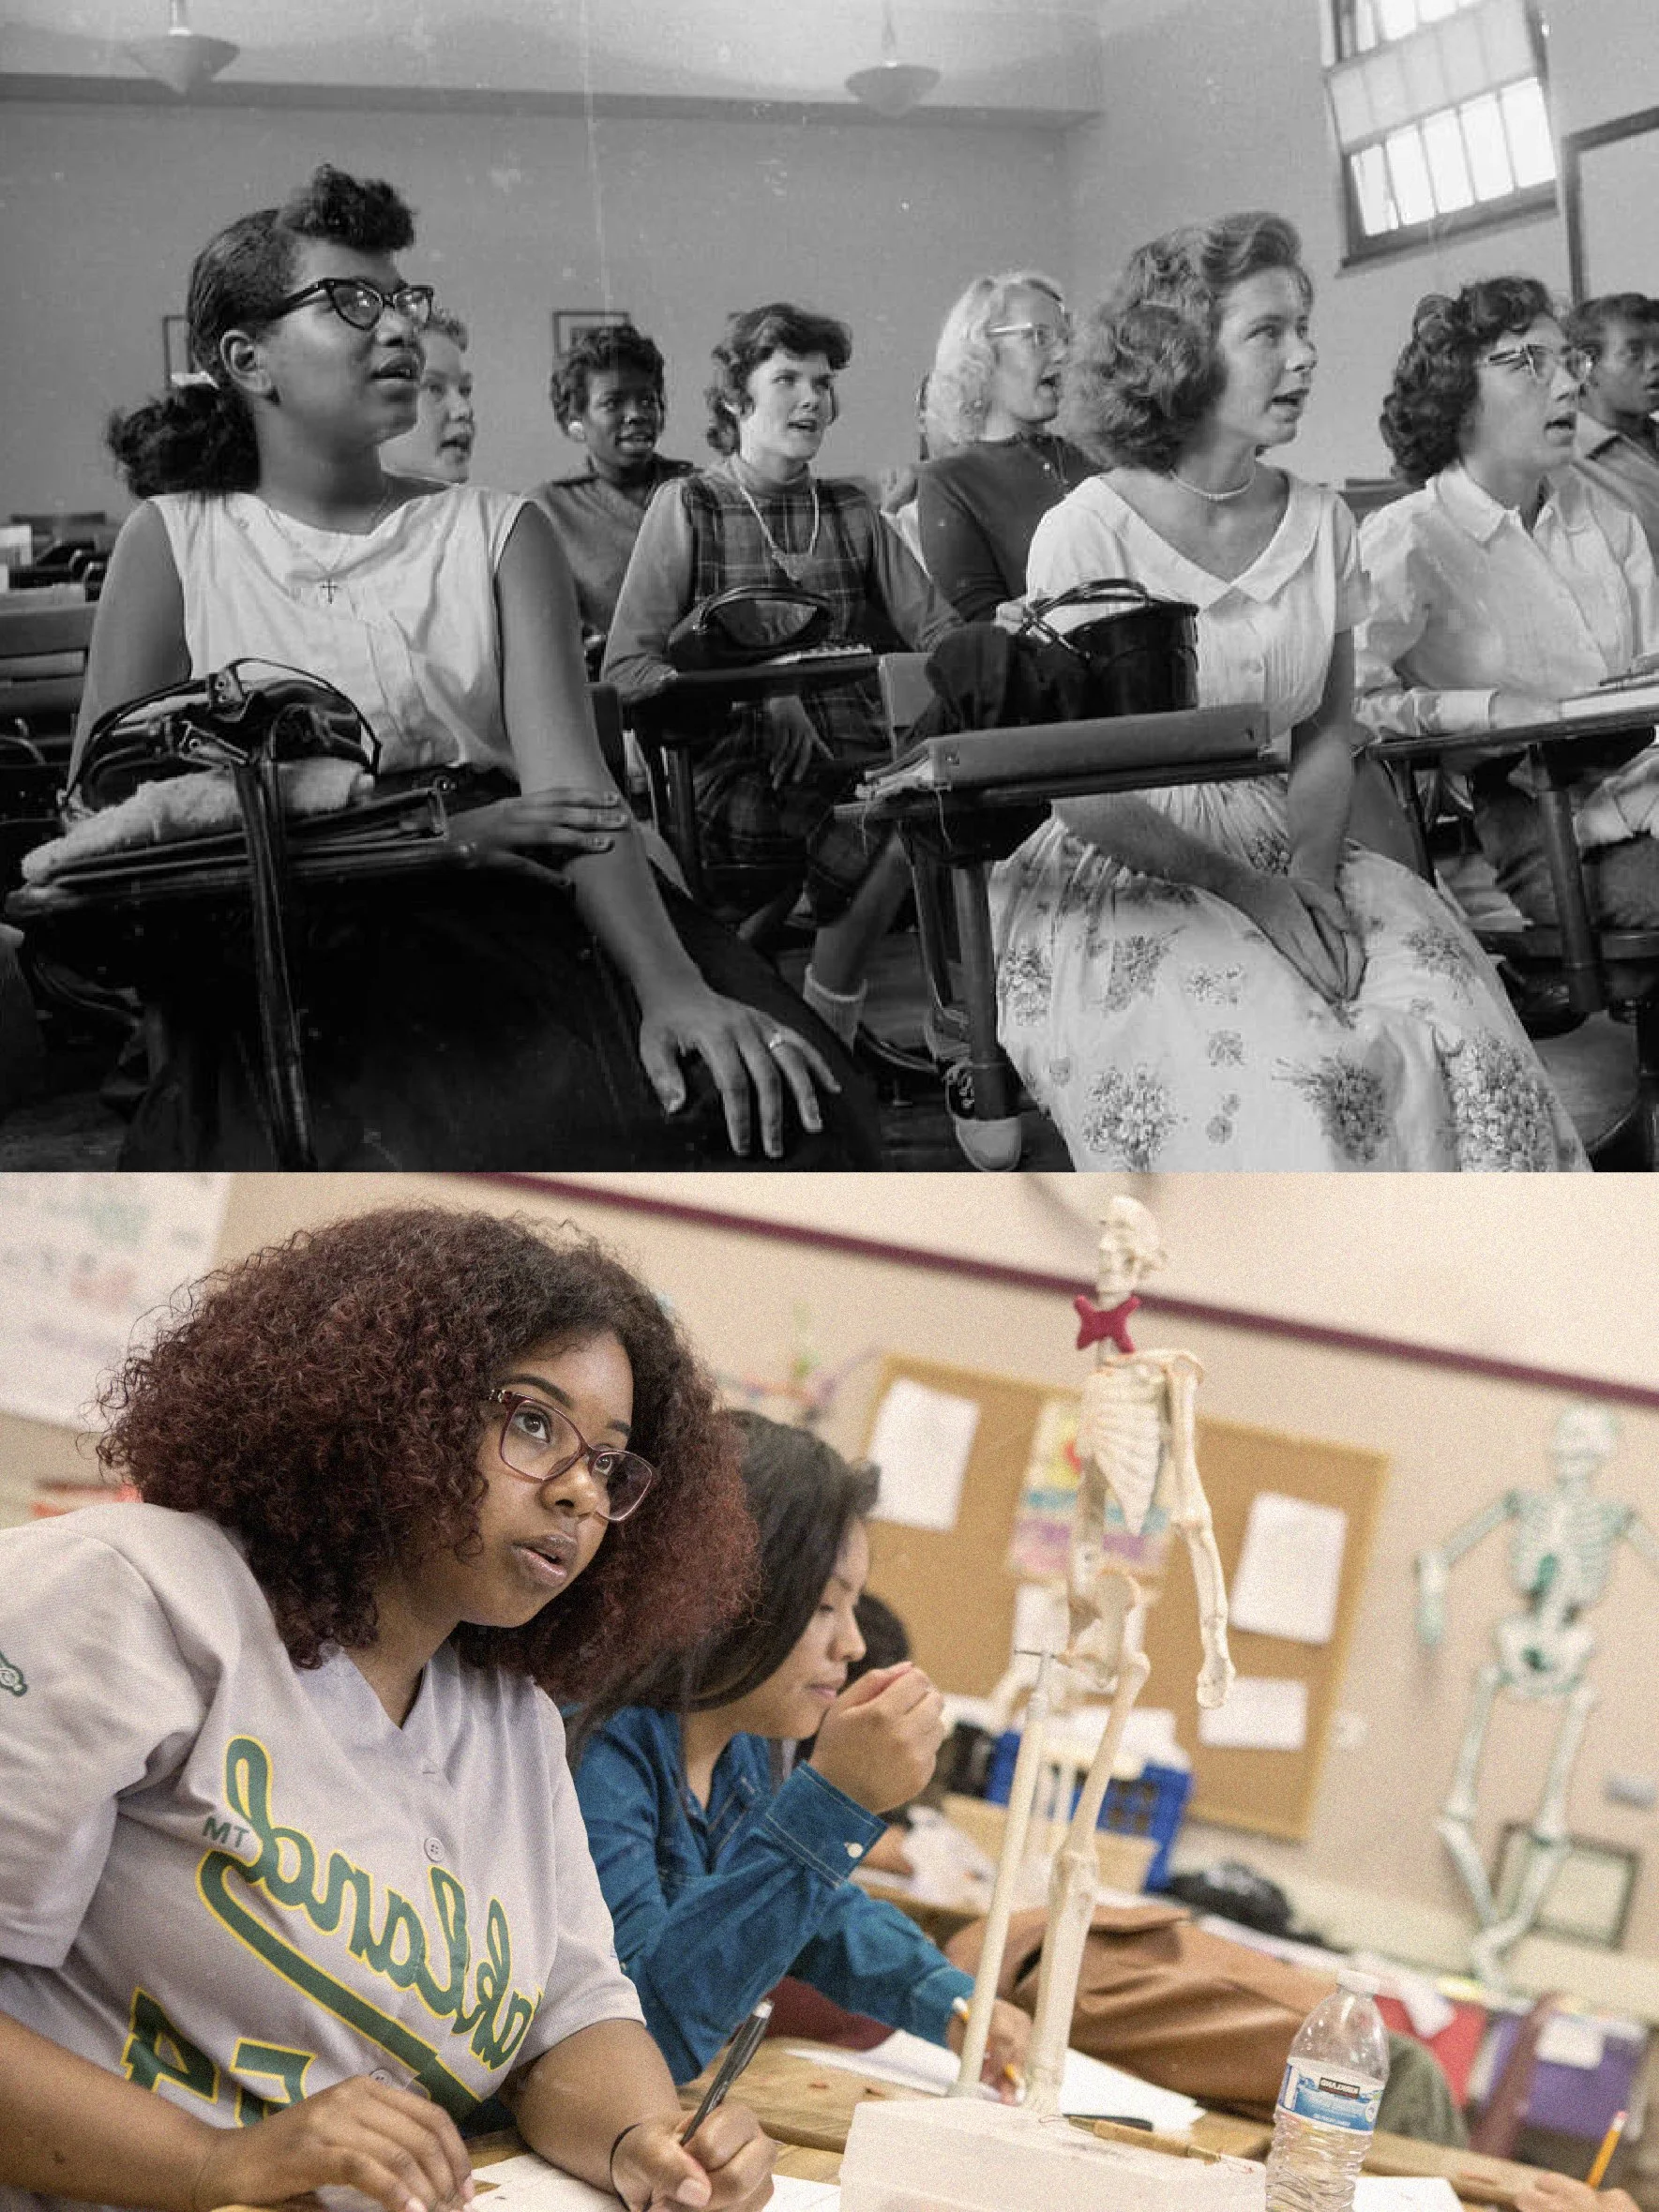
“In approaching this problem, we cannot turn the clock back… We must consider public education in the light of its full development and its present place in American life throughout the Nation.”
Those words were written by the U.S. Supreme Court Chief Justice Earl Warren in the landmark Brown v. Board of Education (1954) ruling about the impossibility of changing the past and the need to address the problem of school segregation at that very moment. America’s public education stakeholders must consider this sentiment today as segregation has not only failed to be eradicated, but has increased over the past few decades to the point that schools are as segregated today as they were in the 1970s.
Segregation ensures division, while integration can lead to significant increases in school resources that produce higher outcomes–particularly for students of color. Additionally, research shows that school integration causes positive, permanent changes in mindset that can improve social cohesion and the health of our democracy.
Researchers Ann Owens and Sean Reardon have estimated racial/ethnic and economic segregation across every school in the U.S. at the Segregation Tracking Project. Using the most recent data from the 2023-24 school year, we have ranked the states by their degree of racial segregation (segregation between white students and minoritized students (Black, Hispanic, and Native American students)) and economic segregation (segregation between students who qualify for Free and Reduced Priced Lunch—a measure of poverty—and those who don’t.)
A value of zero implies no segregation and a value of 1 implies complete segregation. In the measure of economic segregation, for example, a value of 0.3 indicates that, on average, students who are eligible for Free and Reduced-Price Lunch attend schools where the FRPL eligibility rate is 30 percentage points higher than in the schools of those who are not eligible. To learn more about the measure, please check out this short explainer of the normalized exposure index.
We also have included a measure that explains what percentage of total racial/ethnic or economic segregation occurs between school districts (as opposed to within districts). Nevada, for example, has high economic segregation relative to the rest of the country, and that is due almost entirely to segregation between schools in one school district. Therefore, segregation between schools in the same district drives segregation. In contrast, New Jersey has both high racial and economic segregation, and the vast majority of school segregation—95 and 92 percent respectively—is due to segregation between districts; entire districts are segregated. Compared to the rest of the country New Jersey has high between district segregation. Policies that rethink these district lines, like moving to county-wide districts or allowing students and resources to shift between them, have shown the ability to lessen between district segregation.
State ranking by economic segregation
Using the most recent data, we have ranked the states by their degree of segregation between students who qualify for Free and Reduced Priced Lunch (a measure of poverty) and those that don’t.
| State | Rank | Index | % of Segregation Between Districts | % of Segregation Within Districts |
|---|---|---|---|---|
| D.C. | 1 | 0.374 | 0% | 100% |
| New Jersey | 2 | 0.348 | 92% | 8% |
| Nevada | 3 | 0.345 | 10% | 90% |
| Illinois | 4 | 0.329 | 77% | 23% |
| Massachusetts | 5 | 0.326 | 86% | 14% |
| Connecticut | 6 | 0.314 | 87% | 13% |
| North Carolina | 7 | 0.303 | 37% | 63% |
| Virginia | 8 | 0.292 | 52% | 48% |
| New Mexico | 9 | 0.285 | 52% | 48% |
| California | 10 | 0.283 | 66% | 34% |
| New York | 11 | 0.275 | 67% | 33% |
| Texas | 12 | 0.274 | 48% | 52% |
| Rhode Island | 13 | 0.271 | 77% | 23% |
| Arizona | 14 | 0.27 | 59% | 41% |
| South Dakota | 15 | 0.27 | 75% | 25% |
| Ohio | 16 | 0.263 | 85% | 15% |
| Nebraska | 17 | 0.263 | 72% | 28% |
| Colorado | 18 | 0.259 | 54% | 46% |
| Pennsylvania | 19 | 0.259 | 83% | 17% |
| Tennessee | 20 | 0.258 | 49% | 52% |
| Michigan | 21 | 0.255 | 83% | 17% |
| Mississippi | 22 | 0.244 | 68% | 32% |
| Maryland | 23 | 0.243 | 47% | 53% |
| Missouri | 24 | 0.237 | 84% | 16% |
| Indiana | 25 | 0.236 | 81% | 19% |
| Kansas | 26 | 0.236 | 82% | 18% |
| Georgia | 27 | 0.235 | 44% | 56% |
| Alaska | 28 | 0.234 | 46% | 54% |
| South Carolina | 29 | 0.23 | 37% | 63% |
| Delaware | 30 | 0.227 | 36% | 64% |
| Washington | 31 | 0.223 | 70% | 30% |
| Oklahoma | 32 | 0.226 | 74% | 26% |
| Wisconsin | 33 | 0.219 | 77% | 23% |
| Oregon | 34 | 0.216 | 56% | 44% |
| Florida | 35 | 0.205 | 17% | 83% |
| Louisiana | 36 | 0.197 | 29% | 72% |
| Montana | 37 | 0.196 | 78% | 22% |
| Arkansas | 38 | 0.195 | 75% | 25% |
| Alabama | 39 | 0.195 | 62% | 38% |
| North Dakota | 40 | 0.191 | 73% | 27% |
| Utah | 41 | 0.191 | 49% | 51% |
| Minnesota | 42 | 0.177 | 65% | 35% |
| Kentucky | 43 | 0.169 | 49% | 52% |
| Iowa | 44 | 0.166 | 77% | 23% |
| Maine | 45 | 0.163 | 87% | 13% |
| Hawaii | 46 | 0.154 | 0% | 100% |
| West Virginia | 47 | 0.153 | 30% | 70% |
| New Hampshire | 48 | 0.147 | 80% | 20% |
| Vermont | 49 | 0.128 | 82% | 18% |
| Idaho | 50 | 0.124 | 51% | 49% |
| Wyoming | 51 | 0.087 | 56% | 44% |
State ranking by racial segregation
Using the most recent data, we have ranked the states by their degree of segregation between white students and Black, Hispanic, and Native American students.
| State | Rank | Index | % of Segregation Between Districts | % of Segregation Within Districts | |
|---|---|---|---|---|---|
| New York | 1 | 0.544 | 82% | 18% | |
| Illinois | 2 | 0.494 | 88% | 12% | |
| Pennsylvania | 3 | 0.486 | 90% | 10% | |
| Michigan | 4 | 0.475 | 89% | 11% | |
| Ohio | 5 | 0.474 | 91% | 9% | |
| Tennessee | 6 | 0.464 | 79% | 21% | |
| Rhode Island | 7 | 0.454 | 87% | 13% | |
| New Jersey | 8 | 0.437 | 95% | 5% | |
| Missouri | 9 | 0.434 | 92% | 8% | |
| Maryland | 10 | 0.433 | 58% | 42% | |
| Connecticut | 11 | 0.423 | 95% | 5% | |
| Massachusetts | 12 | 0.419 | 92% | 8% | |
| Mississippi | 13 | 0.411 | 77% | 23% | |
| Wisconsin | 14 | 0.407 | 87% | 13% | |
| Indiana | 15 | 0.406 | 90% | 10% | |
| South Dakota | 16 | 0.401 | 84% | 17% | |
| Alaska | 17 | 0.398 | 74% | 26% | |
| Alabama | 18 | 0.392 | 77% | 29% | |
| D.C. | 19 | 0.39 | 0% | 100% | |
| Arkansas | 20 | 0.379 | 87% | 13% | |
| Louisiana | 21 | 0.378 | 48% | 52% | |
| Nebraska | 22 | 0.374 | 84% | 16% | |
| Georgia | 23 | 0.364 | 65% | 35% | |
| Montana | 24 | 0.359 | 94% | 6% | |
| California | 25 | 0.349 | 72% | 28% | |
| Kansas | 26 | 0.345 | 87% | 13% | |
| Kentucky | 27 | 0.333 | 77% | 23% | |
| Minnesota | 28 | 0.331 | 75% | 25% | |
| Arizona | 29 | 0.33 | 72% | 28% | |
| Texas | 30 | 0.326 | 78% | 22% | |
| North Dakota | 31 | 0.321 | 88% | 12% | |
| Florida | 32 | 0.318 | 57% | 43% | |
| North Carolina | 33 | 0.311 | 48% | 52% | |
| Colorado | 34 | 0.309 | 64% | 36% | |
| Virginia | 35 | 0.308 | 60% | 40% | |
| Nevada | 36 | 0.268 | 31% | 69% | |
| Iowa | 37 | 0.266 | 84% | 16% | |
| South Carolina | 38 | 0.26 | 47% | 53% | |
| Washington | 39 | 0.26 | 79% | 22% | |
| Hawaii | 40 | 0.221 | 0% | 100% | |
| Oregon | 41 | 0.22 | 63% | 37% | |
| Oklahoma | 42 | 0.218 | 88% | 13% | |
| Maine | 43 | 0.21 | 87% | 14% | |
| New Hampshire | 44 | 0.193 | 83% | 17% | |
| Utah | 45 | 0.185 | 41% | 60% | |
| New Mexico | 46 | 0.181 | 47% | 53% | |
| Delaware | 47 | 0.175 | 41% | 59% | |
| Idaho | 48 | 0.175 | 75% | 25% | |
| Wyoming | 49 | 0.172 | 77% | 23% | |
| West Virginia | 50 | 0.137 | 43% | 57% | |
| Vermont | 51 | 0.085 | 80% | 20% |
Poverty packing entire districts
Exposing students to concentrated poverty is uniquely harmful. It is very hard to teach and learn in a classroom where almost all students are from low income households, and, therefore are more likely to have unmet health needs or be over-exposed to trauma. District leaders cannot deconcentrate poverty, however, if nearly every student in the district is low-income. In some states—especially those with hundreds of tiny school districts—there are many high-poverty districts located directly next to much wealthier districts. This sort of district-wide "poverty packing" is a uniquely harmful problem that requires state action to address.
These are the five states with the dubious distinction of having the highest level of between district economic segregation in the country:
New Jersey
Massachusetts
Connecticut
Illinois
Ohio
Segregation on the rise
In the two decades following Brown v. Board, federal courts first in the Deep South, then across the country, forced school districts to create plans to end racial segregation. In the 1970s high profile cases such as Milliken v. Bradley in Detroit worked with rising anti-integration backlash to severely limit the federal government’s efforts. Without this accountability, America’s public schools have seen marked increases in racial and economic segregation since the 1980s.
What states can do
While the federal government has taken a back seat in this work, states have wide latitude to create and advance high quality, integrated public schools. From resource sharing and diversity-driven interdistrict transfer plans across communities, to integrated magnet schools purposefully built to connect students across lines of difference, state policymakers can promote excellence while working to fulfill the promise of Brown.
School segregation is not a relic of the past, but with dedicated policy and political will stakeholders can address the problem and begin a new era in American public schooling where students learn together to build the future together.
Learn more about state policy solutions to end school segregation →

Read next

What we can do
State Policy Solutions
We have identified five key policy solutions for state leaders. Progress in any one of these areas would help, but the best results will come from doing them all together.